Conjoint Analysis is an analytic technique used in marketing that helps managers to determine the relative importance consumers attach to salient product attributes or the utilities the consumers attach to the levels of product or service attributes. Conjoint procedures attempt to assign values to the levels of each attribute so that the resulting utilities attached to the stimuli match as closely as possible. Like MDS, Conjoint Analysis relies on respondents subjective evaluations. [Read more…]
Multidimensional Scaling (MDS) for Marketing
Multidimensional Scaling (MDS) is a class of procedures for representing perceptions and preferences of respondents spatially by means of visual display. Perceived psychological relationships among stimuli are represented as geometric relationships among points in multidimensional space. These geometric representations are often called spacial maps. Multidimensional scaling are use for: [Read more…]
Regression Analysis – predicting the future
Let’s start with the definition of regression: Regression is a prediction equation that relates the dependent (response) variable (Y) to one or more independent (predictor) variables (X1, X2).
In marketing, the regression analysis is used to predict how the relationship between two variables, such as advertising and sales, can develop over time. Business managers can draw the regression line with data (cases) derived from historical sales data available to them.
The purpose of regression analysis is to describe, predict and control the relationship between at least two variables. The basic principle is to minimise the distance between the actual data and the perditions of the regression line. Regression analysis is used for variations in market share, sales and brand preference and this is normally done using variables such as advertising, price, distribution and quality.
- Regression analysis is used:
- To predict the values of the dependent variable
- To determine the independent variables
- To explain significant variation in the dependent variable and whether a relationship between variables exists
- To measure strength of the relationship
- To determine structure or form of the relationship
Example:
An online t-shirt sales company invested in Google AdWords advertising:
- £1000 in January
- £1000 in February
- £1000 in March
Their sales grew steadily in this period:
- £5000 in January
- £5500 in February
- £6000 in March
The managers can predict by looking at the regression line that with current level of advertising spent (£1000 per month) the sales in April will be £6500. This obviously would be the case if all other things remain equal but in reality they never do. The sales managers should use the prediction data from the regression analysis as an additional managerial tool but should not exclusively rely on it. The level of sales can be affected by elements other than the level of advertising. This includes, but is not limited to, factors such as weather conditions or the central bank’s increase or decrease of base interest rates. Regression analysis is concerned with the nature and degree of association between variables but does not assume causality (does not explain why there is relationship between variables). Other good examples of how regression analysis can be used to test marketing relevant hypothesis are: Can variation in demand be explained in terms of variation in fuel prices? Are consumers’ perceptions of quality determined by their perceptions in price? For a simple tutorial about the regression analysis for beginners please view the video below:
Regression analysis consists of number of statistics used to determine its accuracy and usefulness for certain purpose. Some of those statistics and methods are clearly explained by the statistics experts in the videos listed below. It is recommended that you read the text first and then watch the corresponding video:
- Product Moment Correlation (r) is a statistic summarising the strength of association between two metric variables (for example: X and Y). It is used to determine whether a linear (straight line) relationship exists between X and Y. It indicates the degree to which the variation in one variable (X) is related to the variation in another variable (Y) (also known as Pearson or Simple Correlation, Bivariate Correlation or Correlation Coefficient). Covariance is a systematic relationship between two variables in which a change in one implies a corresponding change in the other (COV x Y). The correlation coefficient between two variables will be the same regardless of their units of measurement. If r = 0.93 (a value close to 1.0) it means that one variable is strongly associated with the other. It does not matter which variable is considered dependent and which independent (X with Y) or (Y with X). The ‘r’ is designed to measure the strength of linear relationship, thus r= 0 does not suggest that there is no relationship between X and Y as there could be a non-linear relationship between the two.
- Residuals – the difference between the observed value of Y and the value predicted by the regression equation.
- Partial Correlation Coefficient – measures the association between the variables after adjusting for the effect of one or more additional variables. For example: how strongly related are sales to advertising expenditure when the effect of price is controlled?
- Part Correlation Coefficient – is a measure of the correlation between Y and X when the linear effects of the other independent variables have been removed from X but not from Y.
- Non-metric Correlation – a correlation measure for two non-metric variables that rely on rankings to compute the correlations.
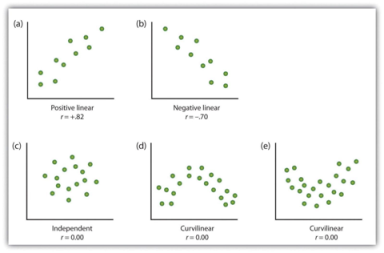
- Scatter Diagram – is a plot of values of two variables for all the cases of observation. The dependent variable on the vertical axis and the independent variable on the horizontal axis. If one variable increases so does the other – there is a linear relationship between X and Y.

Image sourced from Flat World Knowledge
- Least Squares Procedure – is a technique for fitting straight line to a scattergram by minimising the vertical distances of all the points from the line. The best fitting line is a regression line. The vertical distance from the point to the line is the error (e). read more
- Significance Testing – significance of the linear relationship between X and Y may be tested by examining two hypothesis:
- There is no linear relationship between X and Y
- There is a relationship (positive or negative) between X and Y
The strength and significance of association is measured by the coefficient of determination r-square (r2). Significance Testing involves testing the significance of the overall regression equation as well as specific partial regression coefficients.
Multiple Regression
Multiple Regression is extremely relevant to business analysis. Itinvolves single dependent variable such as sales and two or more independent variables such as employee remuneration, number of staff, level of advertising, online marketing spend. For example: can variation in sales be explained in terms of variation in advertising expenditures, prices and level of distribution? It is possible to consider additional independent variables to answer the question raised. Statistics relevant to multiple regression are: adjusted r-square (r2) – coefficient of multiple determination is adjusted for the number of independent variables and the sample size to account for diminishing returns. To get more insight into multiple regression and understand how other statistics such as significance testing influence the usefulness of the analysis please watch the video below:
Multicollinearity – a state of high inter-correlation among independent variables. When multi-collinearity is present, special care is required in assessing the importance of independent variables. Here, once again, it is recommended that you watch the video below.
References:
- Tuk, M., 2012. Regression Analysis, Marketing Analytics. Imperial College London, unpublished.
- Malhotra, K. N. and Birks, F.D., 2000. Marketing Research. An applied approach. European Edition. London: Pearson
Written by Michael Pawlicki
Cluster Analysis – a market segmentation procedure
Cluster Analysis in marketing is a process of grouping consumers of similar psychometric, demographic, geographic or socio-economic attributes into groups called clusters. The primary objective of cluster analysis is to classify objects into homogenous groups based on the set of variables considered. Marketers can use cluster analysis to segment the market and more effectively target the selected segments with relevant to them marketing campaigns. Cluster analysis examines an entire set of interdependent relationships and makes no distinction between dependent and independent variables. Independent relationships between the whole set of variables are examined. Cluster analysis is mainly used for:
- Market segmentation
- Examination of buying behaviour on a collective rather than individual basis.
- Brands in the same cluster usually compete more fiercely with each other. A brand can use cluster analysis for strategic positioning and to identify threats and opportunities on the market.
- With a set of homogeneous geographic clusters marketers can test their strategy on one cluster and if the strategy proves successful it can be expanded to all other clusters of similar characteristics.
- Cluster analysis can be used as a general data reduction tool to manage individual observations.
Simple example:
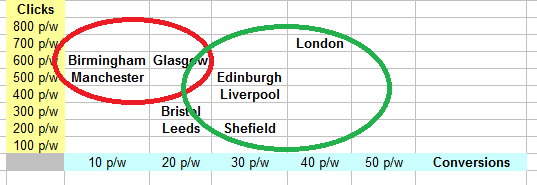
When optimising Google AdWords for our international shipping business we used cluster analysis as a campaign targeting tool. We wanted to reduce the cost of our Google advertising by putting all the large cities in the UK into two homogeneous clusters; the more and the less profitable one. The variables we used for the clustering procedure are:
- Number of paid clicks
- Number of conversions per click (CPC)
We identified from the cluster analysis that there are profitable and non-profitable groups of UK cities for our Google AdWords advertising. Birmingham, Glasgow and Manchester receive high number of clicks but relatively low number of conversions. On the other hand; Liverpool, Edinburgh, Sheffield and London receive higher number of conversions relative to the number of clicks. With this simple clustering procedure we know which geographic areas in the UK should be excluded from our AdWords campaign. The budget consumed by the unprofitable cities can now be allocated to the more profitable ones.
Nowadays cluster analysis is done using SPSS or MS Excel software but in order to understand this procedure properly one should know the mathematical logic behind it. For a simple demonstration of how cluster analysis can be done manually please watch this video:
Statistics associated with cluster analysis:
- Agglomeration schedule gives information on cases being combined at each stage of clustering.
- Cluster centroid is the mean value of all the variables or all the cases in particular cluster.
- Cluster membership indicates the cluster to which each case belongs.
- Dendrogram is a tree graph for displaying clustering results.
- Distances between cluster centres indicate how separate individual pairs of clusters are.
- The process of conducting Cluster Analysis
Formulating the problem is the most important part of the clustering procedure. Selecting one irrelevant variable may distort the clustering solution. Once you define the problem and select the right set of variables you now must select a distance between clusters or similarity measure. The most commonly used measure of similarity is the Euclidean Distance or its square. There are other methods also available and these are used for comparing the results and checking their validity.
Clustering procedure can be hierarchical where clustering is characterised by the development of a hierarchy or treelike structure. Agglomerative clustering starts with each object in a separate cluster and clusters are formed by grouping objects into bigger and bigger clusters. Divisive clustering on the other hand starts with all the objects grouped into a single cluster and clusters are then divided or split until each object is in a separate cluster. K-means clustering is a non-hierarchical clustering and is a procedure which first assigns or determines a cluster centre and then groups all the objects within a pre-specified threshold value together working out from the centre. Deciding on the number of clusters is usually based on theoretical or practical considerations. In hierarchical clustering the distances at which clusters are combined can be used as criteria. In non-hierarchical clustering the ratio of the total within group variance to between group variance can be plotted against the number of clusters.
Interpreting and profiling the clusters involves examining the cluster centroids. The centroids represent the mean values of the objects contained in the cluster on each of the variables. The centroids can be assigned with a name or label. To assess reliability and validity one has to perform cluster analysis on the same data using different distance measures and compare the results to determine stability of solutions. Splitting the data randomly into halves and performing clustering separately on each half and comparing cluster centroids across two sub-samples is one of my favourite ways. In hierarchical clustering the solution may depend on the order of cases in the dataset. To achieve the best results make multiple runs using different order of cases until the solution stabilises.
References:
- Tuk, M., 2012. Cluster Analysis, Marketing Analytics. Imperial College London, unpublished.
- Malhotra, K. N. and Birks, F.D., 2000. Marketing Research. An applied approach. European Edition. London: Pearson
Written by Michael Pawlicki
Marketing Research Process
The process of research for marketing (hereafter called marketing research) usually consists of five underlying parts which are:
- Problem Definition
- Research Plan
- Data Collection
- Data Analysis
- Report Presentation
There are many kinds of marketing research techniques and deciding on which one is right for you depends on what is to be achieved from the research you are conducting.
Exploratory Research is probably the simplest and most often used, not only in marketing but for nearly all research needs. This method is used to explore a problem and provide insights and is particularly useful when there is no initial understanding of the problem.
Descriptive Research is most often used to describe something, usually market characteristics or functions. It is conclusive and used to describe characteristics of groups such as consumers and sales people. It is also used to estimate the percentage of a specified population exhibiting certain behaviours. Descriptive research can be completed as:
- Cross-sectional design – where collection of information from a given sample takes place only once.
- Longitudinal design – is where fixed sample is measured repeatedly. Unlike cross-sectioned research here the same sample of people are studied over time.
Descriptive research, regardless of whether it’s cross-sectional or longitudinal, is completed using questionnaires and/or structured interviews and the data is processed quantitatively.
Causal Research – is used to obtain evidence of cause and effect. Marketing managers like using the data derived from causal research to justify their decisions. Causal research is used to point out which variables cause a known and identified marketing phenomenon. It is also used to determine the nature of the relationship between causal variables and to test hypotheses.
Simple example:
Causal research established that the reduction in price of a product will boost demand for it.In-depth Interviews are unstructured, delivered on a one to one basis and can last from 30 to 60 minutes. Professional interviewers prepare their questions in advance and structure them according to possible interview scenarios. In marketing the in-depth interviews are used to collect information from groups as diverse as industry experts for an informed view of the subject, or general members of the public, including children, to get a layman’s (or potential customer’s) view. The nature of this type of research means it is exploratory where there will be unknown responses to questions. It is therefore important for the interviewers to remain flexible in the structure of their interview and to give the interviewee enough leeway to allow for unexpected findings.
Projective Technique is an unstructured questioning style of research. In marketing it is used to establish the underlying motivations, beliefs, attitudes and feelings of the respondent towards a product or service. The respondent is asked to respond to scenarios by:
- Associating scenarios with words
- Completing sentences
- Completing stories
The purpose of research is not clear to the respondents. Projective techniques are used when required information cannot be obtained by direct methods.
Focus Groups – Conducted by professional moderators and is unstructured and natural. The value of this technique lies in unexpected findings. The focus groups are used for new product development and production of advertising.
Ethnographic Research – The researcher observes social phenomena in their natural setting.
Reference
- Malhotra, K. N. and Birks, F.D., 2000. Marketing Research. An applied approach. European Edition. London: Pearson
Written by Michael Pawlicki

