The concept of elasticity is used to measure the degree of market response to price changes (price sensitivity).
- Elasticity is a measure of demand responsiveness.
- Can be computed for a range of prices and quantities.
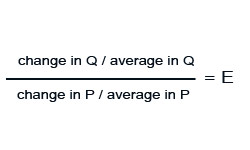
Definition of elasticity:
Percentage change in sales volume divided by the percentage change in sales.

The distinction between elastic and inelastic:
- Demand is elastic when ( E > 1 ) price goes up and revenue goes down. OR Price goes down and revenue up.
- Demand is inelastic when ( E < 1 ) price goes up and revenue up. OR Price goes down and revenue down.
Primary vs. Selective Demand
A product price elasticity can be decomposed into a sales change for the category versus a sales change within the category of products. In consumer products most of the effect of price change results in brand switching.
- 25% primary demand (category expansion)
- 75% selective demand (brand switching)
Estimation of Price Sensitivity (Arc Elasticity) – an average of midpoint elasticity of demand
Example:
Price increases from 10p to 12p
Quantity changes from 40 to 20
Arc elasticity of demand assumes that we should calculate it using the midpoint between 40 and 20 which is 30 and for the price change the midpoint between 10p and 12p which is 11p.
p = pence (£0.01)
The percentage change in quantity is: 20 / 30 = 0.667
The percentage change in price is: 2p / 11 = 0.18
Therefore E = (-0.667) / 0.18 = (-3.7)
Why not just use standard elasticity? Arc elasticity is easy to compute using price experiments, however the calculations usually become cumbersome when multiple price changes must be taken in consideration. Alternatively the managers can use marketing research methods to get better sense of the responsiveness of demand to price (asking customers what would they do if the price changed). Managers can also research their secondary data (already existing data) to establish how price sensitive their customers are. Businesses usually hold historical data of their sales. This kind of data is widely available for packaged goods and for B2B products at the account level. Once the secondary (historical) data is compiled the managers can, using statistical tools, establish price sensitivity for their products. Using already existing data can be effective and accurate as this kind of research relies on the behaviour of real customers under real market conditions. Price elasticities can be estimated while controlling for other factors, for example: promotional activity and competition.
Example:
Microsoft increased prices for their software from £49 to £89 (increase by £40). This resulted in reduction in sales by 30%.
Percentage of price increase calculation: 40 / 49 = 0.82 so the price of software has gone up by 82%
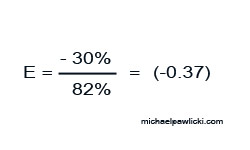
The above calculation is an example of inelastic demand where E < 1 ( E= -0.37).
The strategic conclusion one can draw from this example is that Microsoft has a great competitive advantage over its competitors.
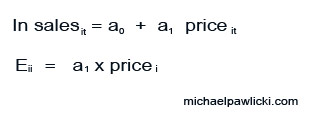
Computing Elasticities from Regression
Semi Log Model
Linear Model

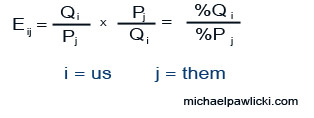
Cross Price Elasticity
Is a measure of the effect of price change by competitor on a company own demand.
How to calculate cross price elasticity?
Example
There is an asymmetric cross price elasticity between Hochland Cheese and Tesco Brand Cheese. When Hochland increases its price the demand for Tesco Brand Cheese increases as well and vice versa. Another good example of high cross price elasticity is the relationship between the price is Coca Cola and Pepsi.