Multidimensional Scaling (MDS) is a class of procedures for representing perceptions and preferences of respondents spatially by means of visual display. Perceived psychological relationships among stimuli are represented as geometric relationships among points in multidimensional space. These geometric representations are often called spacial maps. Multidimensional scaling are use for:
- To determine the number and nature of dimensions consumers use to perceive different brands.
- To position brands on these dimensions.
- To identify the position of consumer’s ideal brand.
Applications in marketing:
- Brand image measurement
- Market segmentation
- New product development – by looking at the spacial map the empty spaces represent the unexplored by competitors market segments. The development of a product or a service to fit in the unused space on the spacial map might have a commercial sense.
- Assessing advertising activities and its effectiveness – some marketing campaigns are designed to re-place a brand from one part of the market to another (possibly more profitable or relevant to a company’s competitive advantage).
- Distribution channel decisions – managers by looking at the multidimensional map of relevant brands can judge whether creating an additional retail outlet near other brand’s outlets is compatible with their branding strategy.
Statistics Associated with MDS:
- Similarity judgments: it is possible to pair brands using Likert Scale.
- Brand preference rankings – order of brands from the most preferred to the last preferred.
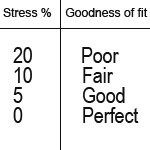
- Stress Test measures the degree of fit – the higher the number of stress the poorer the fit.
- R-square – is a squared correlation index that indicates the position of variance.
- Spacial map illustrates perceived relationships among brands (presented as geometric relationships).
Conducting Multidimensional Scaling
In order to initiate multidimensional scaling formulate the problem first. This requires the researcher to specify the purpose for which the MDS results would be used and select brands or other stimuli to be included in the analysis (minimum 8 brands should be considered to achieve a well-defined spacial map).
How to Obtain Input Data?
- Ask the respondents directly to judge how similar or dissimilar various brands or stimuli are using their own criteria (Likert Scale questionnaires are practical here).
- Derived approach – requires the respondents to rate the brands on the set of identified earlier brand attributes using semantic differentials or Likert Scales.
For example: Best Drink with Food —— Best Drink on its own.
Direct vs. Derived Methods
In direct methods the researcher does not have to identify a set of salient attributes and respondents make similarity judgments using their own criteria as they would in normal circumstances.
In derived approach it is easy to identify the respondents with homogeneous perceptions. These respondents can be clustered based on their attribute ratings. A disadvantage of this method is that the researcher must identify all the salient attributes.
Selecting an MDS Procedure
The key factor that influences the selection of procedure is whether the procedure will be conducted at the individual level or at an aggregate level. Marketing strategies however are usually based on aggregate data.
Deciding on Number of Dimensions
The objective of MDS is to obtain spacial map that best fits the input data in smallest number of dimensions. In spacial maps the fit improves with the number of dimensions. The fit of MDS is assessed by Stress Test. The higher the number of Stress the poorer the fit.
Suggestions for Determining Number of Dimensions
- Prior knowledge of the subject of study.
- More than three dimensions are difficult to interpret.
- Its easier to work with two dimensions.
Labeling the Dimensions and Interpreting Configurations
Once spacial map is created the dimensions must be labeled and configuration interpreted. After providing preference data the respondents may be asked to indicate the criteria they used in making their evaluations. Vertical axis may be labeled ‘taste strength’ and represent for example the power of particular flavours. The horizontal axis may be labeled ‘after taste’ representing the flavour that lingers pallete after try.
Assessing Reliability and Validity of MDS
The input data and consequently the MDS solutions are invariably subject to substantial random variability and it is therefore necessary to assess data suitability.
- Index to fit or R-square should be examined. It indicated how well the MDS model fis the input data.
- Stress values can also indicate how valuable the MDS solutions are:

- If an aggregate level analysis has been done, the original data should be split into two or more parts. MDS analysis should be conducted separately on each part and results compared.
Limitations of MDS
It is assumed that the similarity of stimulus A to B is te same as the similarity of B to A but this assumption is not necessarily true.

Speak Your Mind