Cluster Analysis in marketing is a process of grouping consumers of similar psychometric, demographic, geographic or socio-economic attributes into groups called clusters. The primary objective of cluster analysis is to classify objects into homogenous groups based on the set of variables considered. Marketers can use cluster analysis to segment the market and more effectively target the selected segments with relevant to them marketing campaigns. Cluster analysis examines an entire set of interdependent relationships and makes no distinction between dependent and independent variables. Independent relationships between the whole set of variables are examined. Cluster analysis is mainly used for:
- Market segmentation
- Examination of buying behaviour on a collective rather than individual basis.
- Brands in the same cluster usually compete more fiercely with each other. A brand can use cluster analysis for strategic positioning and to identify threats and opportunities on the market.
- With a set of homogeneous geographic clusters marketers can test their strategy on one cluster and if the strategy proves successful it can be expanded to all other clusters of similar characteristics.
- Cluster analysis can be used as a general data reduction tool to manage individual observations.
Simple example:
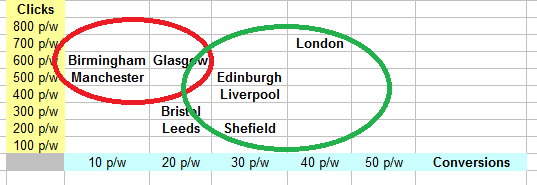
When optimising Google AdWords for our international shipping business we used cluster analysis as a campaign targeting tool. We wanted to reduce the cost of our Google advertising by putting all the large cities in the UK into two homogeneous clusters; the more and the less profitable one. The variables we used for the clustering procedure are:
- Number of paid clicks
- Number of conversions per click (CPC)
We identified from the cluster analysis that there are profitable and non-profitable groups of UK cities for our Google AdWords advertising. Birmingham, Glasgow and Manchester receive high number of clicks but relatively low number of conversions. On the other hand; Liverpool, Edinburgh, Sheffield and London receive higher number of conversions relative to the number of clicks. With this simple clustering procedure we know which geographic areas in the UK should be excluded from our AdWords campaign. The budget consumed by the unprofitable cities can now be allocated to the more profitable ones.
Nowadays cluster analysis is done using SPSS or MS Excel software but in order to understand this procedure properly one should know the mathematical logic behind it. For a simple demonstration of how cluster analysis can be done manually please watch this video:
Statistics associated with cluster analysis:
- Agglomeration schedule gives information on cases being combined at each stage of clustering.
- Cluster centroid is the mean value of all the variables or all the cases in particular cluster.
- Cluster membership indicates the cluster to which each case belongs.
- Dendrogram is a tree graph for displaying clustering results.
- Distances between cluster centres indicate how separate individual pairs of clusters are.
- The process of conducting Cluster Analysis
Formulating the problem is the most important part of the clustering procedure. Selecting one irrelevant variable may distort the clustering solution. Once you define the problem and select the right set of variables you now must select a distance between clusters or similarity measure. The most commonly used measure of similarity is the Euclidean Distance or its square. There are other methods also available and these are used for comparing the results and checking their validity.
Clustering procedure can be hierarchical where clustering is characterised by the development of a hierarchy or treelike structure. Agglomerative clustering starts with each object in a separate cluster and clusters are formed by grouping objects into bigger and bigger clusters. Divisive clustering on the other hand starts with all the objects grouped into a single cluster and clusters are then divided or split until each object is in a separate cluster. K-means clustering is a non-hierarchical clustering and is a procedure which first assigns or determines a cluster centre and then groups all the objects within a pre-specified threshold value together working out from the centre. Deciding on the number of clusters is usually based on theoretical or practical considerations. In hierarchical clustering the distances at which clusters are combined can be used as criteria. In non-hierarchical clustering the ratio of the total within group variance to between group variance can be plotted against the number of clusters.
Interpreting and profiling the clusters involves examining the cluster centroids. The centroids represent the mean values of the objects contained in the cluster on each of the variables. The centroids can be assigned with a name or label. To assess reliability and validity one has to perform cluster analysis on the same data using different distance measures and compare the results to determine stability of solutions. Splitting the data randomly into halves and performing clustering separately on each half and comparing cluster centroids across two sub-samples is one of my favourite ways. In hierarchical clustering the solution may depend on the order of cases in the dataset. To achieve the best results make multiple runs using different order of cases until the solution stabilises.
References:
- Tuk, M., 2012. Cluster Analysis, Marketing Analytics. Imperial College London, unpublished.
- Malhotra, K. N. and Birks, F.D., 2000. Marketing Research. An applied approach. European Edition. London: Pearson
Written by Michael Pawlicki

